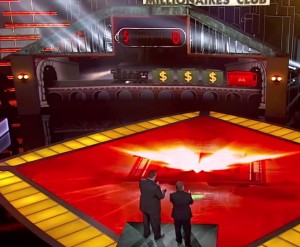
There have been many attempts to translate Monopoly, often considered one the worst board games ever, to television. A series of pilots in the late 80s failed to get off the ground. ABC ran a pretty good attempt of bringing the game to the small screen as a 13 week summer series in 1990, paired with the epic Super Jeopardy! tournament. In more recent times, elements of the board game have been found on the Hub’s Family Game Night. And now, with backing by the Multi-State Lottery Association, a new show based on Monopoly has hit syndication, Monopoly Millionaire’s Club.

In an alternate universe, we’d be watching “The Landlord’s Game Millionaires’ Club”.
Monopoly Millionaire’s Club is a special subgenre of game show called a lottery show. Depending on where you live, that term either has you nodding your head in recognition (if you live in a state with a proud history of lottery shows like Illinois or California), furrowing your brow in confusion (if you live in most of the rest of the US), or nodding your head in recognition even though you’re wrong (if you live in the UK, where “lottery show” has a different connotation). In the US, a lottery show is a game show that is produced by a lottery commission. It looks, sounds, and smells like a game show to the untrained eye, but there are three key differences that separate a lottery show from a standard game show.
- Contestants are chosen through the lottery. Often times lottery commissions will run a series of special tickets where either the main prize or a “second chance” prize is an appearance on one of their shows as a contestant. This is the only method of contestant recruitment, which provides a different type of contestant than the carefully controlled contestant selection process of most game shows.
- By law, all competition must be luck based, not skill based. In order for the lottery commission to get away with giving away prizes on these shows, they have to ensure that it truly remains a lottery. You’ll never see any trivia questions or obstacle courses be played on a lottery show.
- The prizes on a lottery show are much, much bigger than on regular shows. It makes sense, since the lottery commission is bankrolling the show, that they can afford to give away large amounts of money in prizes. On most game shows nowadays, winning even a 6-figure sum is quite rare. On lottery shows, you’ll see 6 and 7 figure prizes won with regularity.

Your contestant selection process.
Lottery shows are a perfect subject for us here at Game Show Theory. To prevent the games from becoming a boring procession of “pick a number, win some money”, the show will often include an element of risk that the contestant must face, choosing to put their current winnings at jeopardy in order to win more. It’s these decisions that allow us to analyze these games and develop strategies for them.
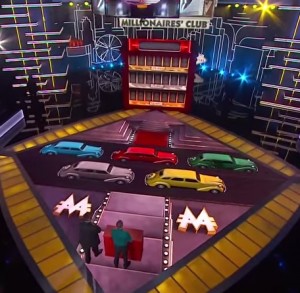
On MMC, contestants are chosen from the audience of lottery winners to come and play a game for themselves and their section of the audience. All money won is split half by the player, and half with their audience section. So far, there are 8 games in the rotation, each one inspired by a different aspect of Monopoly. Each game can see the player win a maximum of $100,000, but each game could also see a too-greedy player leave with $0.
I took a look at each game and determined the optimal strategy for playing it, usually by brute-forcing my way through all possible decision paths possible in the game. Then, I determined the average amount of money a player would win by following that strategy, as well as their chances of winning the top prize or nothing. It turns out that there is a large difference in what you can expect to win in each game. The 8 games, placed in order from least profitable to most, are:
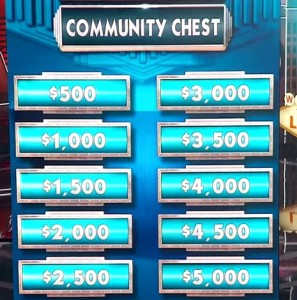
8. Community Chest
Average: $16,339.77
Chance of Winning $100,000: 4.5%
Chance of Winning $0: 31.3%
Any resemblance this game has to Deal or No Deal is purely coincidental.
Purely. Coincidental.
10 identical sealed boxes, $100,000, just one question. Have I said purely coincidental yet?
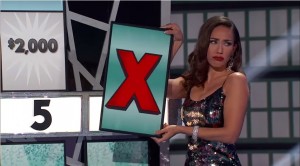
The contestant is faced with 10 boxes, each with a money amount in them, from $500 up to $5,000. Pick a box, win that amount of money. Simple enough. However, there’s a temptation. The remaining boxes all have their money amounts double. If the contestant wants to, they can give back the money they have and select a different. If they choose to do that, they box they select must contain a prize equal or greater in value to the one they give back. If that’s the case, then the remaining boxes double again and the same offer is made. This process can be repeated until the contestant wins a box worth $100,000 (if doubling a box’s value would take it past $100,000, the value instead gets set at $100,000.) If they choose a box with a smaller value than the one they give back, they lose and win nothing.
Yeah, you’re not buying the “purely coincidental” line anymore, are you?
The strategy formula for this game is rather simple.
M is the value you currently own, n is the number of boxes left in the game, and the sum of Mp is the total money left in the remaining boxes (ignoring values that would end the game). As long as this formula is true, you should play on. If it’s false, you should stop with your current winnings.
This game is by far the worst game to play, partly because it’s so easy to lose before accumulating a decent sum. For example, if you select the $5,000 box with your first selection, you’re facing a choice of either walking with that paltry sum or playing on with a 4/9 chance of being knocked out. You have to cheat death, so to speak, many times before being able to even have a chance to earn $100,000 in this game, much less actually win it. An average value of over $16,000 may not sound bad, but when the best game on the list has an average value three times that, you see just how bad of a game this is.
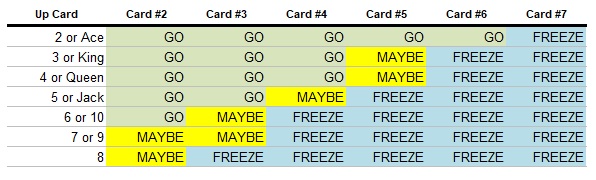
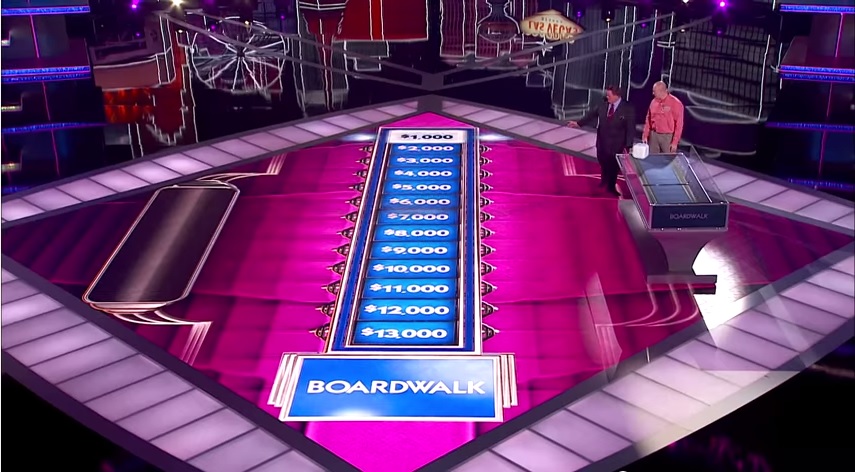
7. Advance to Boardwalk
Average: $28,708.46
Chance of Winning $100,000: 16.4%
Chance of Winning $0: 33.8%
Unfortunately, nothing to do with the spin-off board game from the 80’s. The game is played on a fourteen step board. Each step has a money amount on it starting at $1,000 and increasing by $1,000 up to $13,000 on Step 13. Step 14, however is Boardwalk, and worth $100,000 if landed on by exact count (if a contestant rolls a number that would take them beyond Boardwalk, they do not move). The contestant rolls a die, and moves the number of spaces rolled. Each money amount that is landed on (not passed over) is added to their bank. The catch is, they cannot roll the same number twice. They are given one freebie which allows them to ignore their first duplicated roll, but any more duplicate rolls after that bankrupts them and ends the game.
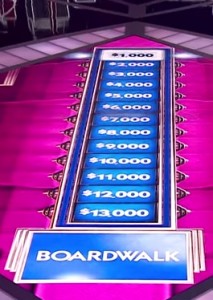
The Money … Ladder? How about Money Midway?
Despite the simplicity of the game, it took a lot of effort to work out the correct strategy to this game. We can lay out a couple of obvious ground rules. Firstly, you should keep rolling as long as you still have your Free Roll token, since you are in no danger. Just as obviously, you should stop whenever all of the safe rolls would take you beyond Boardwalk, as there’s no gain to be had.
What to do on the first 4 rolls is simple enough: you roll, no matter what. There’s no combination of rolls that would give you a high enough bank to not make rolling again worthwhile.
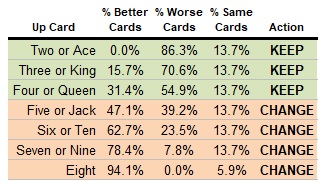
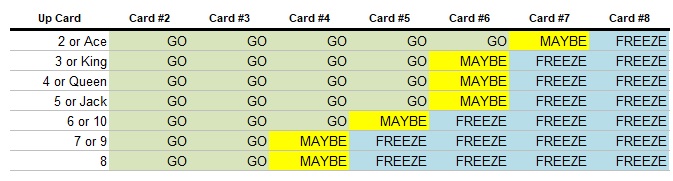
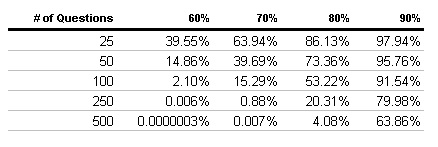
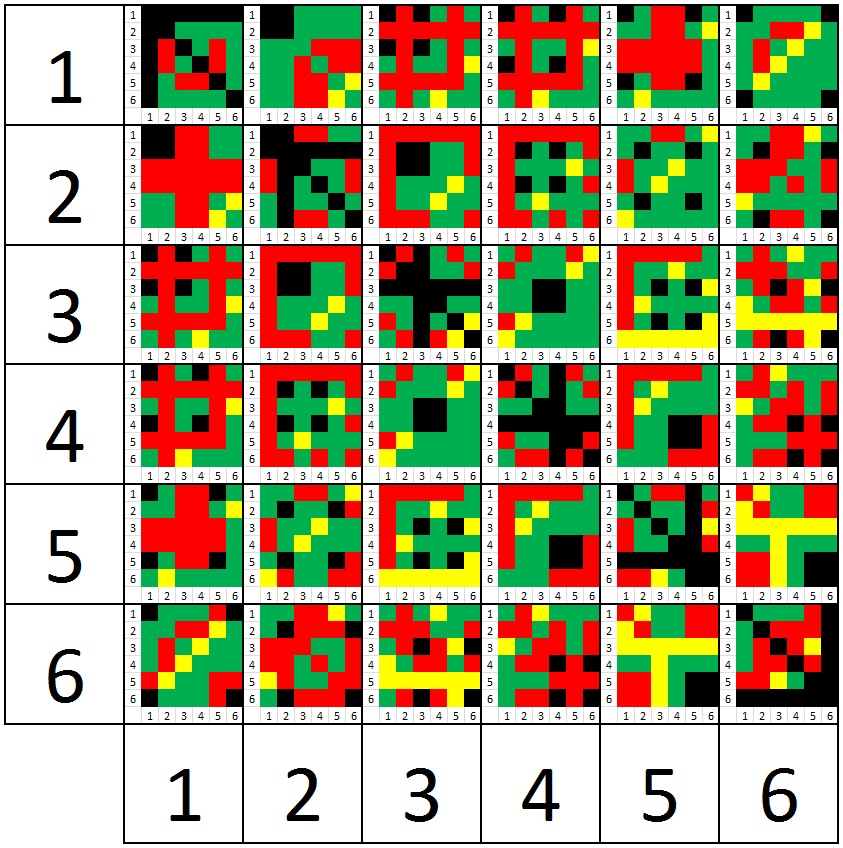
Turn 5 is the big question. I’ve tried to suss out some simple rules for playing this turn, but as far as I can tell there are no hard and fast rules. I can say that you should generally play on as long as you can still land on Boardwalk, but even a rule as simple as that has exceptions. The best that I can do is give you this (ahem) easy-to-read chart.

(Click to embiggen)
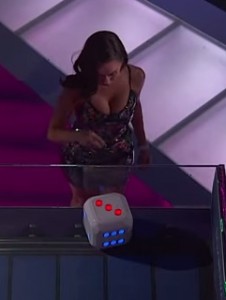
Turning the sides of the die red when they become bad rolls is a very swish touch.
That’s not pixel art or a quilt pattern, that’s the chart that tells you what to do on Turn 5. The big numbers correspond to what you rolled in the first (going up and down), and second (going left to right) turns. Doing that will lead you to another 36-cell chart, where you can find your action by cross-referencing your third (going up and down) and fourth (going left to right) rolls. If the box is gold, then you’ve already landed on Boardwalk, congratulations! Similarly, if the box is black, you’ve already lost the game. Otherwise, if the box is green, you should play on, and if it’s red you should quit.
Turn 6 is a little simpler to understand. You can create some rules based on the space you’re currently on:
– $13,000: Always stop.
– $12,000: Roll on if 2 is still a good number and you have less than $20,000 OR exactly $22,000.
– $11,000: Roll on if 3 is still a good number and you have less than $22,000.
– $10,000: Roll on if 4 is still a good number and you have less than $23,000.
– $9,000: Roll on if 5 is still a good number.
Turn 7, if we get that far, is very easy to play. Always stop. It’s never worth it to play on.
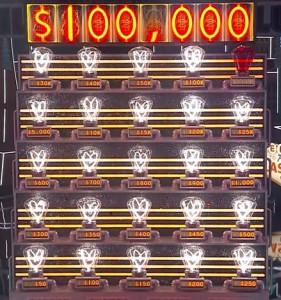
6. Electric Company
Average: $33,074.05
Chance of Winning $100,000: 11.8%
Chance of Winning $0: 26.5%
I told you our electric bill would skyrocket if you turned on every light in the house!
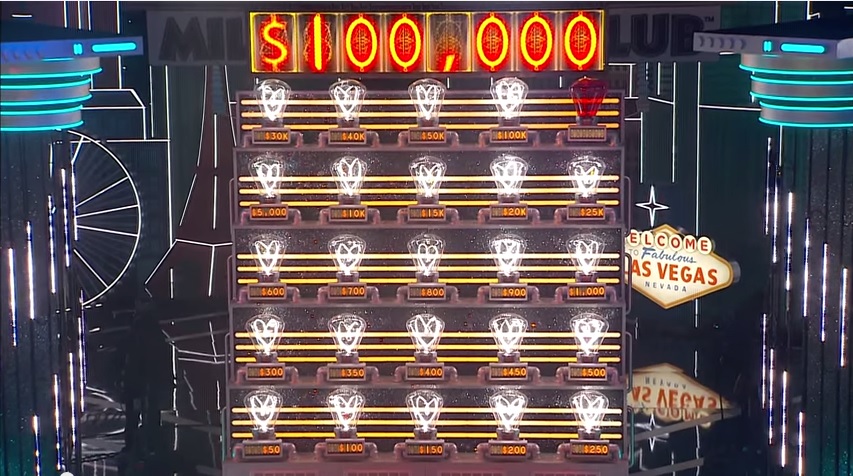
The player is presented with 25 light bulbs, and 10 switches. Each switch will light up a number of light bulbs from 1 to 10. Each number is associated with only one switch, so if you find a switch that lights up 4 light bulbs, you know none of the other switches will also light 4 bulbs.
The goal of the game is to light as many bulbs as you can. Each bulb lit is worth an increasing amount of money, up to $100,000 with bulb 24. Light up bulb 25, however, and you cause a blackout, losing all your money. You can stop at any time, leaving with the money accumulated up to that point.
We can’t give you a strict dividing line as to when you should stop and when you should continue, since that depends on the configuration of switches left in play. What we can give you is a formula for figuring out if you should continue or not. It’s exactly the same as the formula we used in Community Chest:
M is the amount of money you currently have, n is the number of switches left to pull, and Sum(Mp) is the total of the possible outcomes if you were to pull the next switch. Again, as long as the left side of the equation is smaller than the right side, you should play on.
You want switches? We got switches!
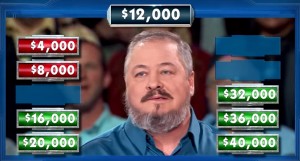
Let’s walk through the game play in the first episode as an example. At the first time the contestant faces a decision, she’s lit up 19 light bulbs, worth $20,000. She has 7 switches left, worth 1, 2, 3, 5, 7, 8, and 10. Thus, the left side of our equation is $20,000 * 7 = $140,000. The possible outcomes if she went on are $25,000, $30,000, $40,000, $100,000, and $0 three times over. The sum of those outcomes is $215,000. Thus it is the right decision to move onward.
She moved onward, and flipped the switch worth 3 bulbs, increasing her total to $40,000. Now there are 6 switches left, worth 1, 2, 5, 7, 8, and 10 bulbs. The left side of the equation is $240,000, while the right side is only worth $150,000. She should stop, which is what she chose to do.
5. Park It!
Average: $34,217.59
Chances of Winning $100,000: 32.3%
Chance of Winning $0: 56.9%
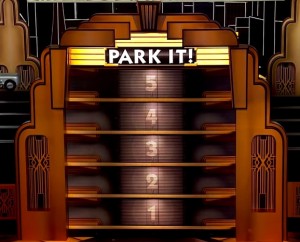
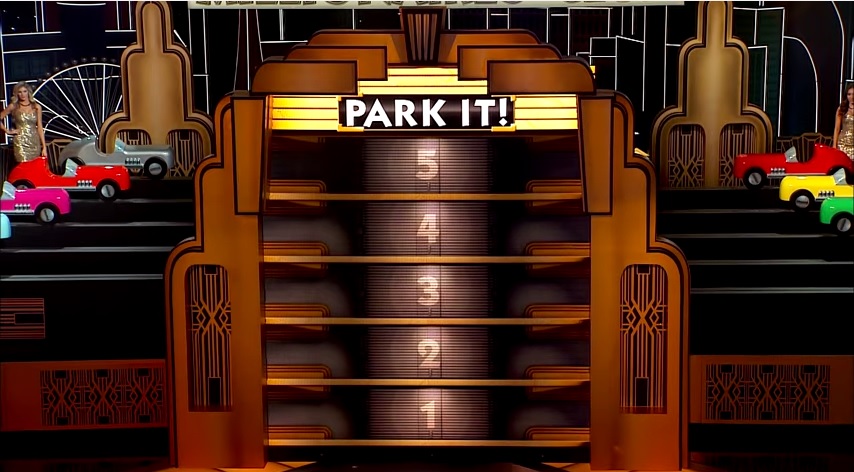
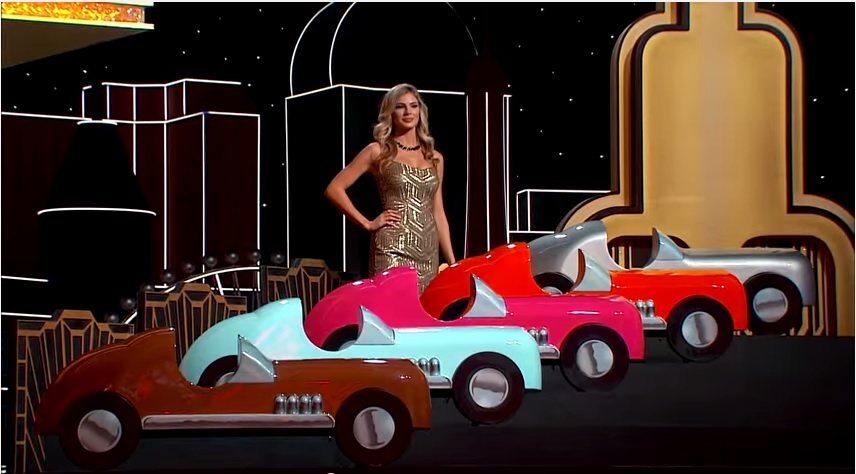
Two words that strike fear in every driving test taker.
The Monopoly Parking Garage (must have been in an edition I didn’t own) has five floors, each of which can take one car (just like the real Atlantic City, right?). 10 cars are waiting to be parked, each carrying a value between $1,000 and $10,000. The contestant chooses a car, and once the value of the car is revealed, chooses which level of the garage to park it in. The cars must be parked in order of value, with the highest value car on the top floor, and cannot be changed once parked. If a car cannot be parked, it’s game over. However, successfully parking five cars will win $100,000. At any time, the contestant can walk away with the value of the parked cars.
This is a difficult game to win, as the majority of the time you will win nothing. On the other hand, it’s an easy game to play, as the best strategy when it comes to placing the cars is almost always the intuitive, common sense strategy, trying to keep as many cars in play with each placement. About the only surprise that will happen commonly comes on the first placement. If you find the $2,000 or $9,000 car, they should be placed on the 2nd and 4th floors, respectively, to prevent a potential game over on turn 2.

The best solution for games where everybody wants to play as the race car.
The first time you should consider stopping is after placing the third car, and that’s only if you have three of the seven remaining cars able to be placed. As long as you can still place a majority of cars, it’s right to continue. After placing the fourth car, compare your bank to the following formula:

C is the number cars that will fit in the final open slot. If your bank is bigger than that number, then stop.
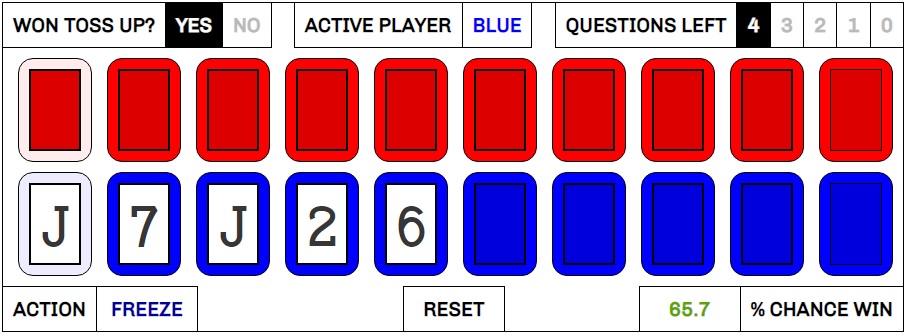
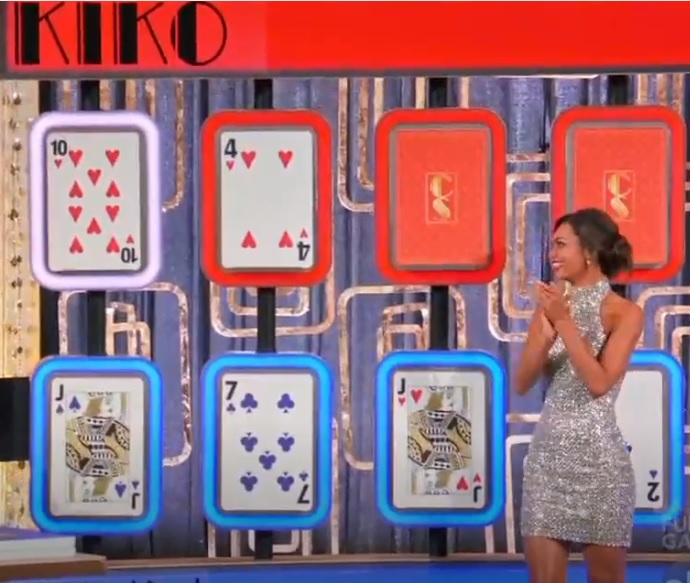
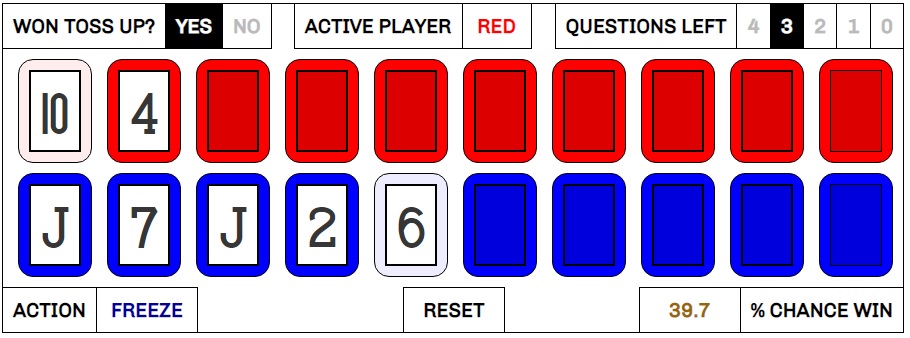
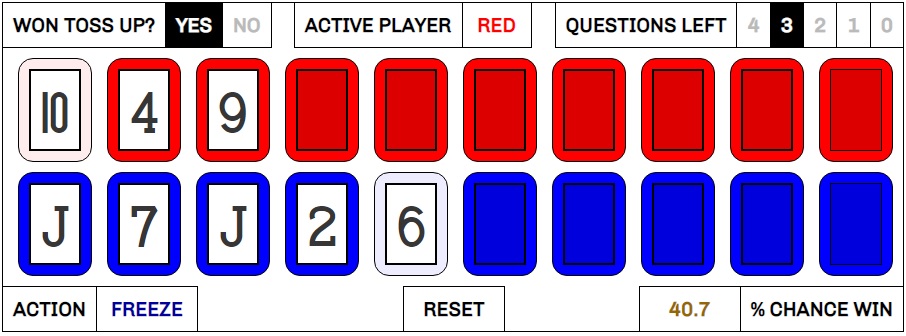
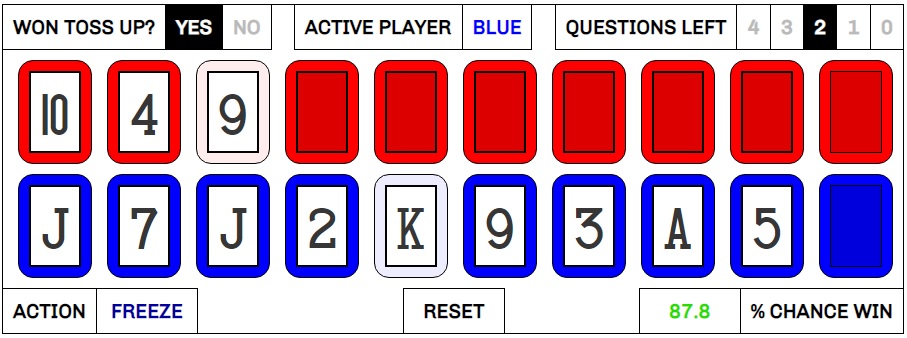
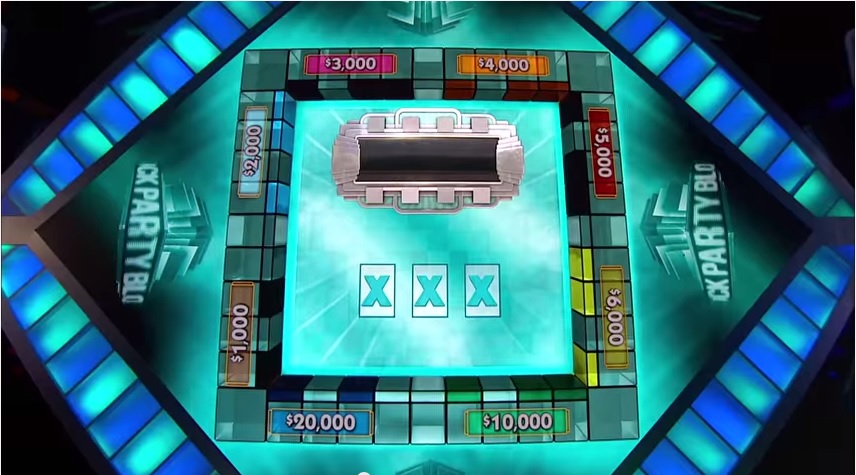
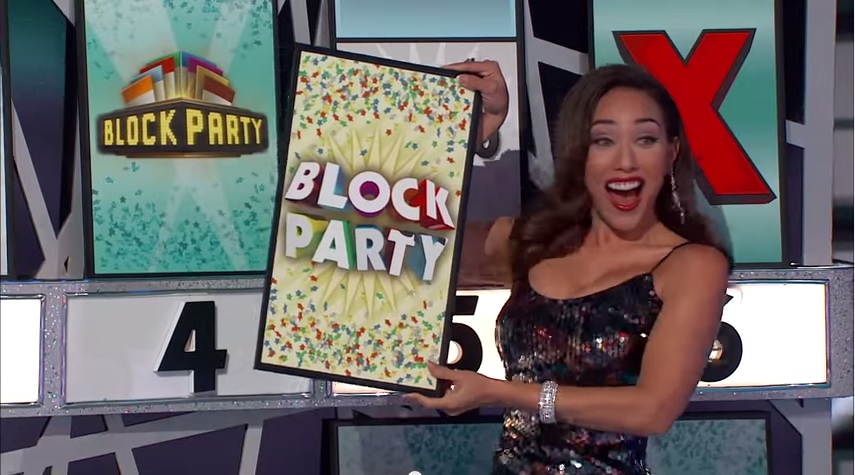
4. Block Party
Average: $36,434.83
Chance of Winning $100,000: 26.1%
Chance of Winning $0: 41.6%
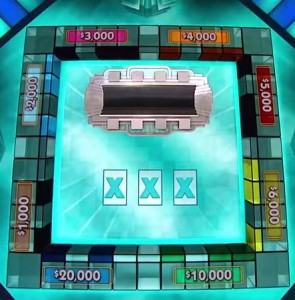
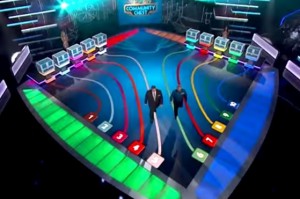
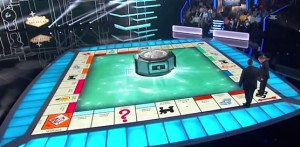
Yes, they animate a game board in the middle of the bigger game board that makes up the set. It’s Boardception.
The contestant is presented with an array of 12 face down cards. 8 of the cards are associated with a color group on the Monopoly board, and have a cash value starting with $1,000 for Mediterranean/Baltic, and going up to $20,000 for Park Place/Boardwalk. Picking those cards lights up the respective monopoly on the board, and banks the associated cash. 3 of the cards are strikes. Get 2 strikes, and your bank is cut in half, though you may continue to play. Find all three strikes, and you leave with nothing. The remaining card is the “Block Party” card. Find that card and you can light up one whole side of the board, up to 2 monopolies. If you light up all eight monopolies before finding the third strike, you win $100,000. And, of course, you can leave at any time and win the value of your bank.
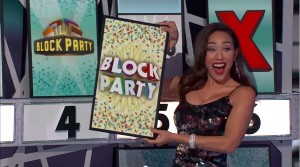
The Thrill of Victory.
The first strategic question is how to use the Block Party card – to maximize money won or to maximize blocks won? Testing both scenarios showed that there was a clear winning strategy: light up as much as you can, regardless of their value. It is much more profitable in the long run to light up the Dark Purples and Light Blues and only put $3,000 in your bank, than to light up only the Dark Blues for $20,000.
The second and much harder question to answer is when you you should stop. After playing around with a bunch of different strategies, the best formula I have discovered for determining whether or not to quit is as follows:
If Block Party card is on the board:
After Block Party card is found:
The Agony of Defeat.
S is the number of strike cards left on the board, and P is the number of property cards left. For example, at the start of the game, the formula would be as such:

Not coincidentally, that’s pretty close to the average value of the game. As long as that value is greater than the value of your bank, keep picking cards.
3. No Vacancy
Average: $38,729.46
Chance of Winning $100,000: 4.6%
Chance of Winning $0: 2.3%
From Yelp: “Very expensive for the area. Front desk forced us all to stay on the same floor. 2 Stars.”
The contestant is tasked with filling up all three floors of a Monopoly hotel. Each floor has seven rooms. On each turn, five cars come out, of which the contestant must select one. Each car has a unique number of people in it, from 1 to 5. The contestant has to choose which floor to put those people on; there must be enough room left on the chosen floor, and all people in a car must be put on the same floor. If none of the floors have enough open rooms to fit the number of people in the chosen car, the contestant wins nothing. Each room filled on the bottom floor is worth $1,000, the middle floor $2,000, and the top floor $3,000. Fill up all the rooms, and you win $100,000.
This game is one of the hardest to win, but also one of the hardest to win nothing. The best strategy is to stop playing once your top floor has 4 or more rooms filled and the other two floors have 3 or more rooms filled (thus making the car with five people in it unplayable). There are a few exceptions to that rule where you should continue:
– 4 Rooms filled in the top and 3 Rooms filled in the middle.
– 3 Rooms filled in the middle and the bottom filled completely.
– 4 Rooms filled top, the middle filled completely, and 3 Rooms filled bottom.
– 4 Rooms filled top, and both middle and bottom filled.
– 3 Rooms filled bottom, and both the top and middle filled.
Can I ask the drivers if they drove in the the carpool lane on their way here?
Following this strategy maximizes your winnings, but will see you ending the game prematurely about 93% of the time.
What was really surprising to me was the optimal strategy to use when filling rooms. My assumption going in was that it would be very straightforward: fill the top row until you come to a number you can’t fill there, then move on to the middle row and then the bottom. It turns out that the strategy to maximize your winnings is much, much more complex. For example, on the first turn you should fill the rooms on the top floor, unless you pick the car which has 4 people in it, in which case they should go in the middle row! I tried sussing out some placement rules to use, but I couldn’t generate an easy-to-follow list of rules. I placed the optimal strategy in a spreadsheet if you’re interested in the gory results.
2. Bank Buster
Average: $42,592.69
Chance of Winning $100,000: 24.6%
Chance of Winning $0: 19.0%
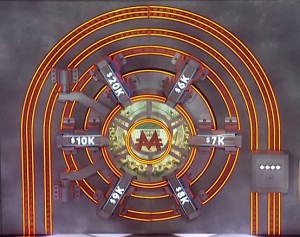
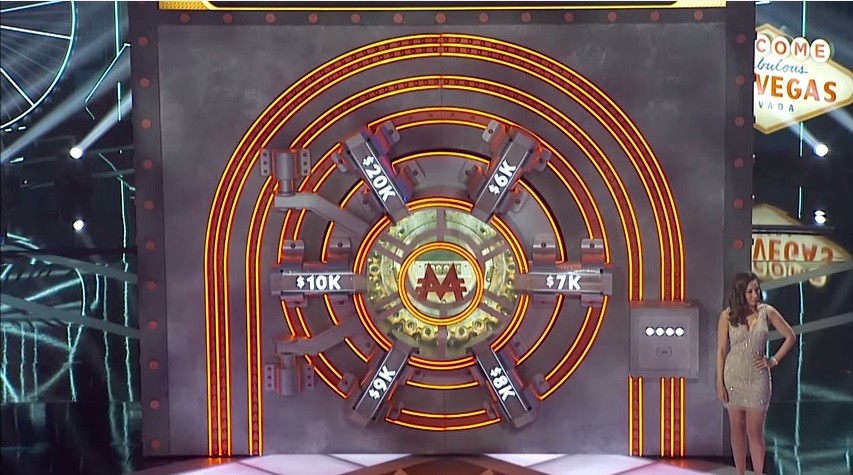
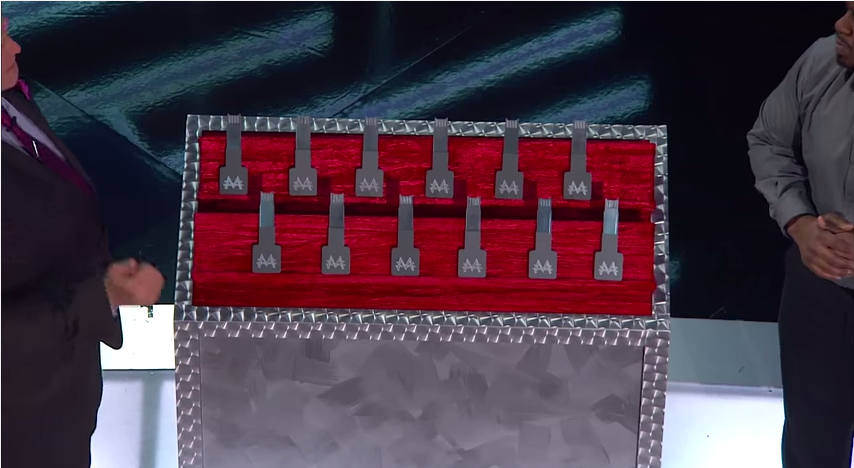
Say we get into the cage, and through the security doors there and down the elevator we can’t move, and past the guards with the guns, and into the vault we can’t open…
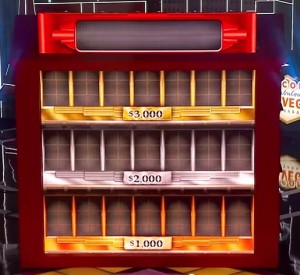
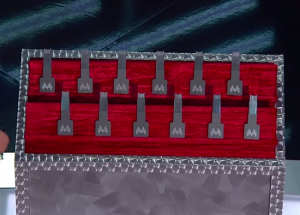
The contestant is presented with a bank vault, locked with six locks. Twelve keys are given to the contestant to select one at a time. Each lock has two different keys that will unlock it. Unlock a lock, and an amount of money is added to your bank depending on the lock, from $6,000 up to $20,000. However, if you select a key that fits an already opened lock, that lock gets re-locked for good, and the money taken away from you. You need to unlock five of the six locks to earn the top prize of $100,000. If you manage to re-lock two locks, thus making the game unable to be won, you lose everything.
Five keys too many for Jack Narz, seven keys too few for Richard Bacon.
Not only is this game very likely to end well for the contestant, but the optimal strategy is also very simple. The first time you want to consider stopping is after your 4th key. If you have re-locked a lock and are in danger of losing, stop if your bank is $26,000 or more (except in the very specific case that you’ve unlocked the $6K and $20K locks, and the re-locked lock is the $7K lock), otherwise go on. After you’ve picked 5 keys, stop the game with $21,000 or more in your bank (unless you have exactly $21,000 and the $20K lock is still available to open). Finally, stop with 6 keys if your bank has reached $34,000. The game is guaranteed to end one way or another after 7 keys have been chosen.
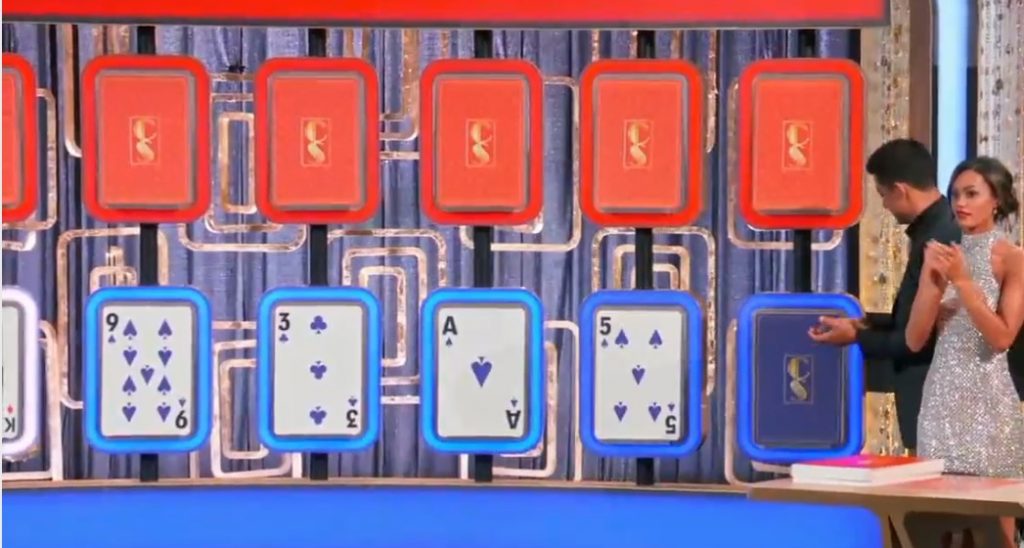
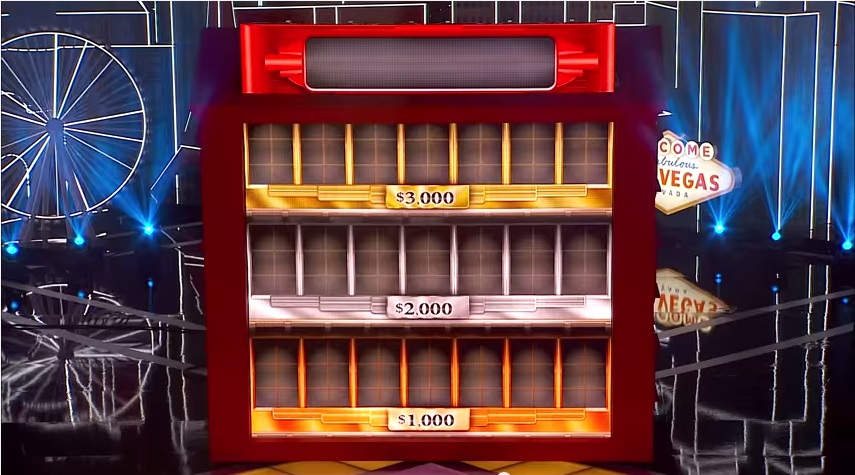
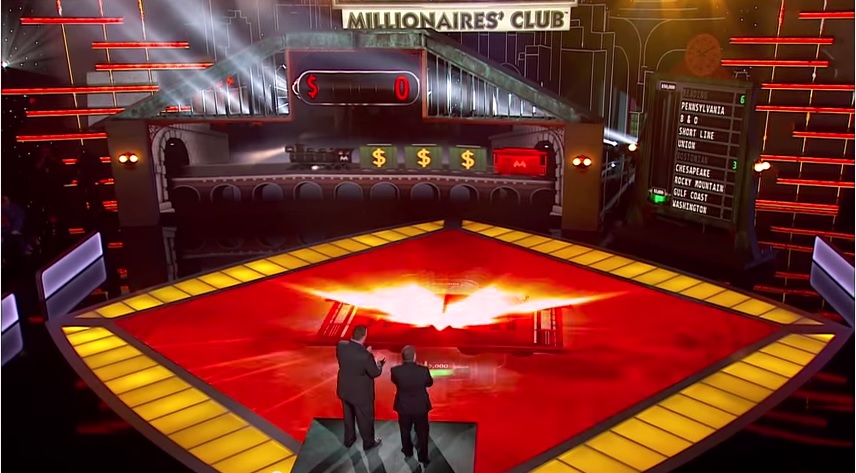
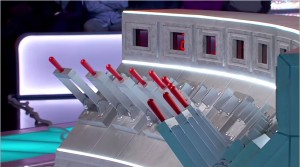
1. Ride the Rails
Average: $49,942.86
Chance of Winning $100,000: 39.5%
Chance of Winning $0: 7.1%
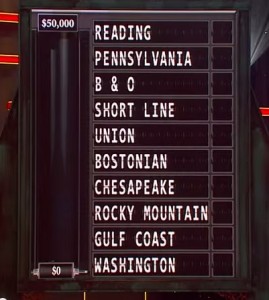
I’ve sold monorails to Chesapeake, Gulf Coast, and Washington, and, by gum, it put them on the map!
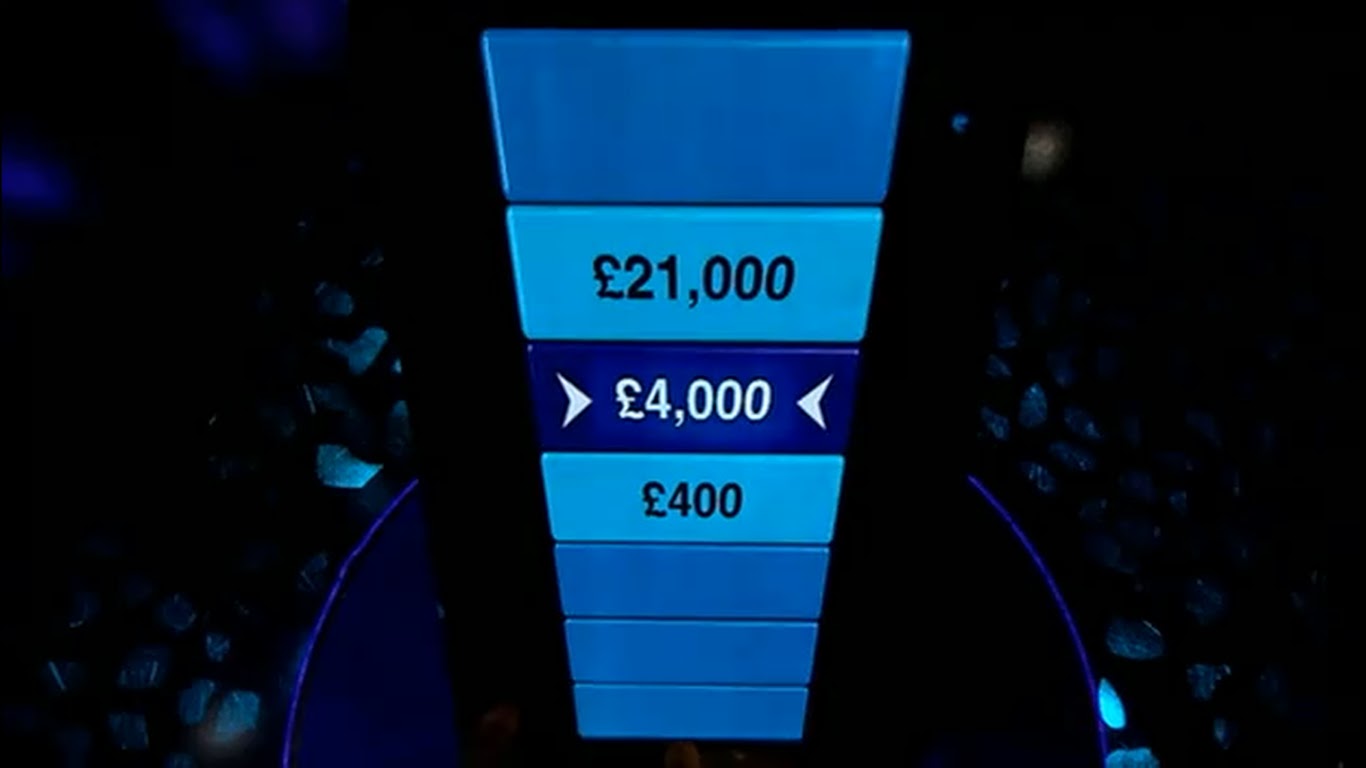
This game is pretty similar to ITV’s 2009 show The Colour of Money. That should have sent a shiver down your spine if you’re unlucky enough to remember The Colour of Money.
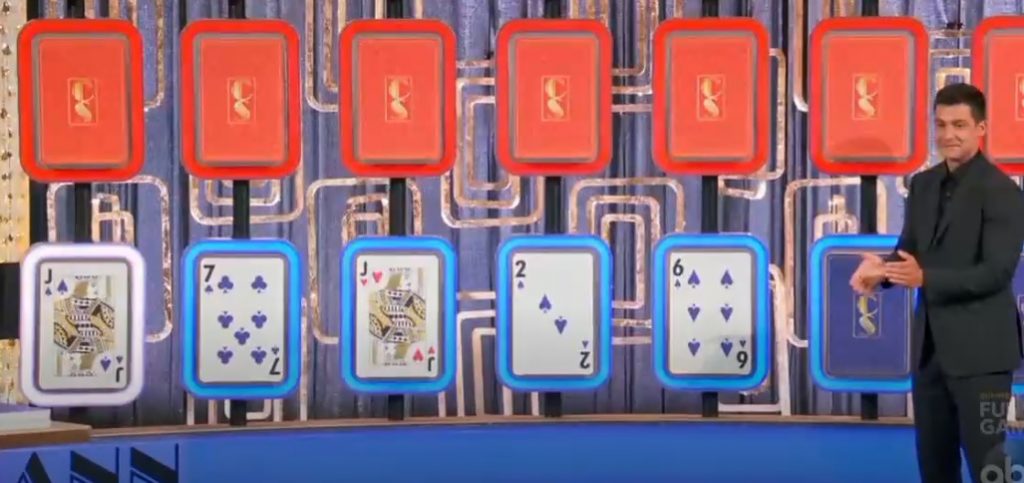
The contestant is presented with a list of ten railroad lines. Each line has a railroad engine carrying between one and ten boxcars, called “cash cars”, and a caboose. Each train has a unique number of cash cars between 1 and 10, like the switches in Electric Company. Once a contestant chooses a line, that line’s train will slowly make it’s way across the floor, revealing its cash cars. Each cash car revealed is worth money: $1,000 for the first line chosen, $2,000 for the second, $3,000 for the third, and $5,000 for the fourth. At any time, the contestant can stop the train and bank the value of the cash cars revealed. This is important, because if the caboose comes out, all of the money earned on that train is lost (money won on previous trains is kept, though). If the contestant manages to earn $50,000 after four trains, then their total is doubled to $100,000.
Thanks to combinatorics, we know there are only 5,040 different combinations of trains that could be selected. We can also create an exhaustive list of strategies, where a strategy is the number of cars we will let pass before hitting the brakes in each round. Since the possible number of cars in a train changes in later rounds based on what was picked in earlier rounds, we’ll define strategies in terms of the length of possible trains in each round. For example, if a strategy told us to stop after the 3rd train in the second round, that would mean stopping after 3 cars if we picked a train from 4-10 in the first round, or stopping after 4 cars if we pick a train from 1-3 instead. To reflect the incentive of trying to reach $50,000 to win the maximum prize, we’ll also add a special strategy that can be chosen in the fourth round: “End”, where we will let the train continue until we’ve hit $50,000 or we see the caboose.
Stop on a Whammy!
After testing every possible strategy against every possible configuration of trains, the winning strategy is fairly simple: 6, 5, 4, End. In other words, we let 6 cars pass in the first round before stopping. In the second round, let the number of cars pass equal to the 5th longest train in the second round. In the third, we want to see a number of cars equal to the 4th longest train left on the board. Finally, we go for $50,000 or bust in the last round. This strategy will win us, on average, almost $50,000, making this game the most profitable game to play.
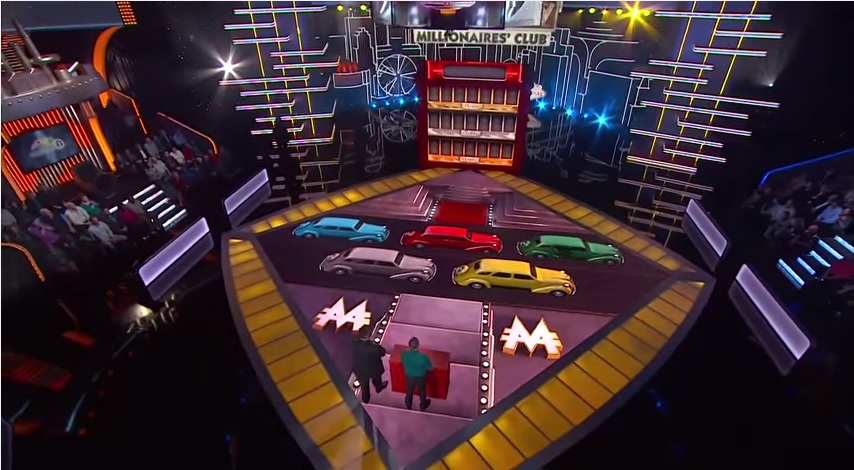
BONUS: Go for a Million
Average: $176,140+
Chance of Winning $1,000,000: 7.8%
Chance of Winning $0: 15.2%
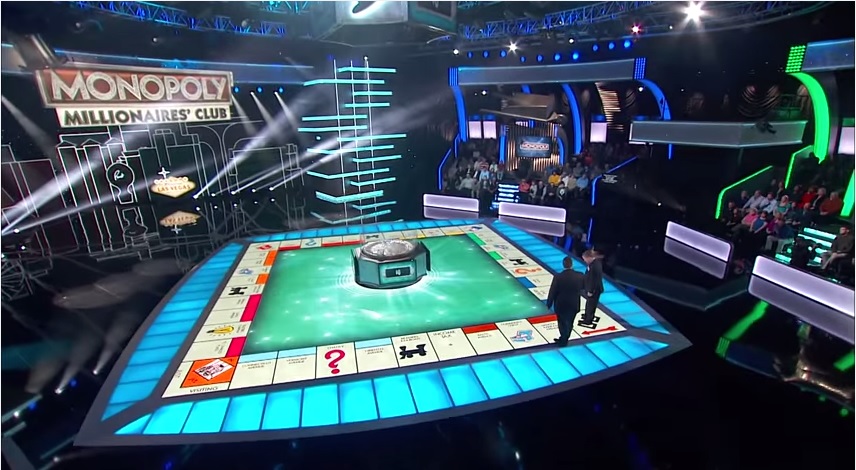
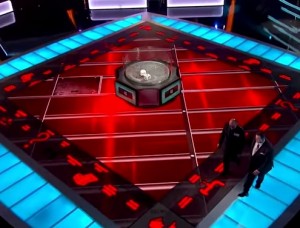
The big board in action, with the (sigh) “Monopoly Rock ‘n Roller” die roller in the middle.
The end game is almost identical to the end game to the 1990 version of Monopoly, for those of us who remember it. The contestant starts on GO, and has 5 rolls to traverse the 40 squares of the board and return back to GO. Along the way, the contestant earns money for each square he lands on, which he can stop with at any time. If the contestant rolls doubles, he gets another roll, but like in the board game, three straight doubles and you’re off to jail with no money. Likewise, landing on Space #30, “Go To Jail”, is also an instant lose. You can also lose by landing on Community Chest and Chance spaces; contestants have to draw a card when they land on that space, which like the game could be a “Go To Jail” card. If you make it around the board and pass GO, you win $200,000. However, if you land right on GO, you win $1,000,000 for yourself, and your audience section gets a rolling Audience jackpot.
“Can’t I just pay $50 and try again?”
In order to play this, you first have to give back whatever you’ve won in the first game. Since the expected value of the game is over $176,000, you should always give back anything you won previously, even a maximum prize of $100,000. I’m not able to calculate the exact value of the game, since I don’t have a list of how much money you win by landing on every property. The figure listed above is only counting the $200,000 for passing GO, and $1,300,000 for landing on GO, assuming the value of the Audience jackpot to be $300,000.
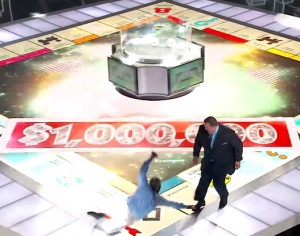
What happens when you win $1,000,000. Sliding into GO optional.
Also, I don’t really have a strategy for whether you should stop or not. I doubt that you should ever stop, since the chances of failure are so small compared to the potential payout. I suppose it might be possible if, as a worst case scenario, you are on Indiana Avenue, seven squares away from “Go To Jail”, after having rolled two doubles with only one roll left. Since you have a 33% chance of failure in that scenario (⅙ of the time you’ll roll a 7 to land in jail, ⅙ of the time you’ll roll your 3rd double) with no chance of hitting the jackpot, you’re probably better off quitting then. But situations like that are so rare that it’s not worth the effort to try to quantify them. Just keep rolling, and hopefully you’ll be rolling in the dough before long.